
Which fund deserves each slot, and does the whole model hold up?
Two questions, one workflow. First pick the fund that fills each slice on evidence rather than on a star rating; then prove the resulting allocation against real history before you commit money to it.
"Which fund deserves each slot?"
Keep the workflow you already trust: run Fidelity's or Schwab's fund screener, pick your categories, and check ETFs and no-transaction-fee funds. Paying a fee every rebalance is how good plans die. Then bring the candidates into RangefinderInvest and let the evidence sort them.
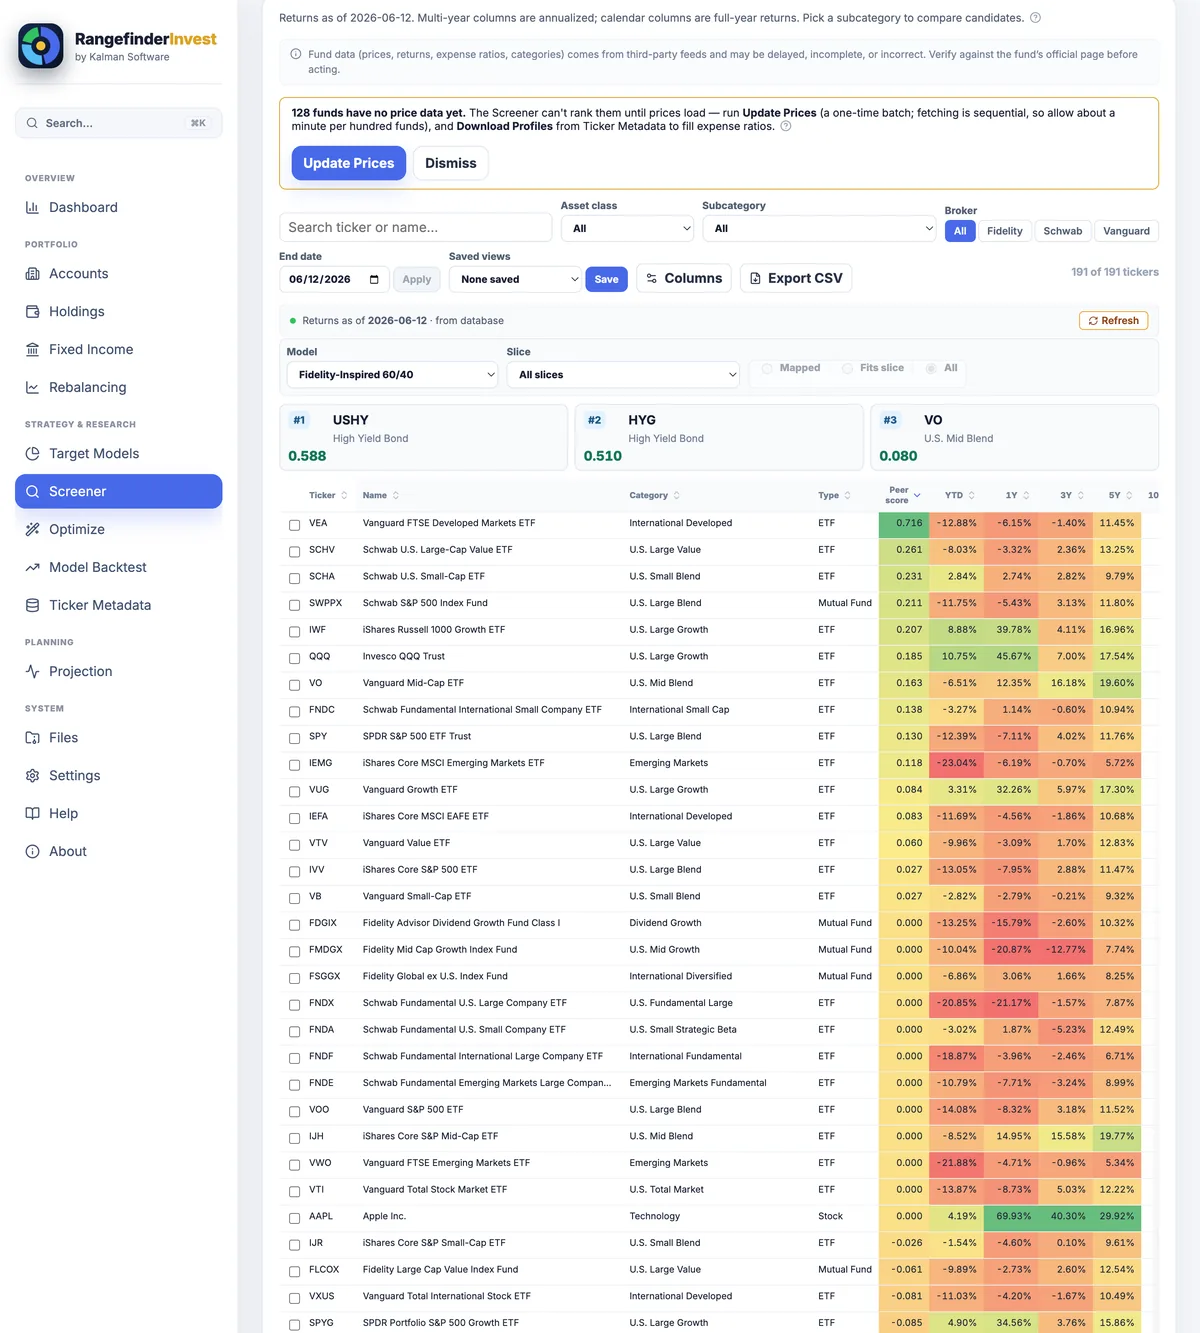
Heatmap your universe
Trailing & calendar-year returns plus risk, green to red, ranked by a tunable, Sharpe-like Score.
Rank by slice fit
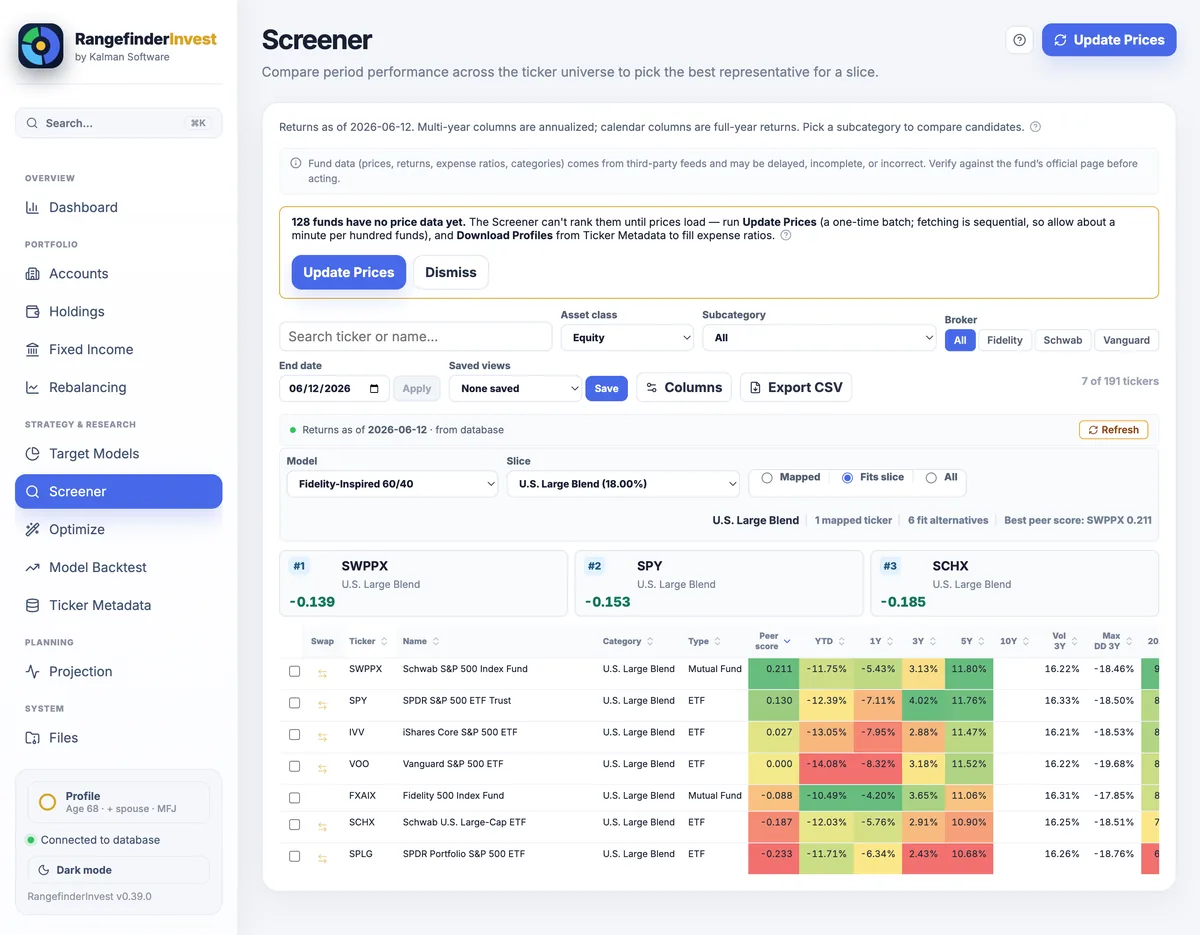
Narrow to one slice, such as "U.S. Large Blend," and see SPY / VOO / SPLG / SCHX scored and graded Exact / Close / Broad.
Swap it into the model
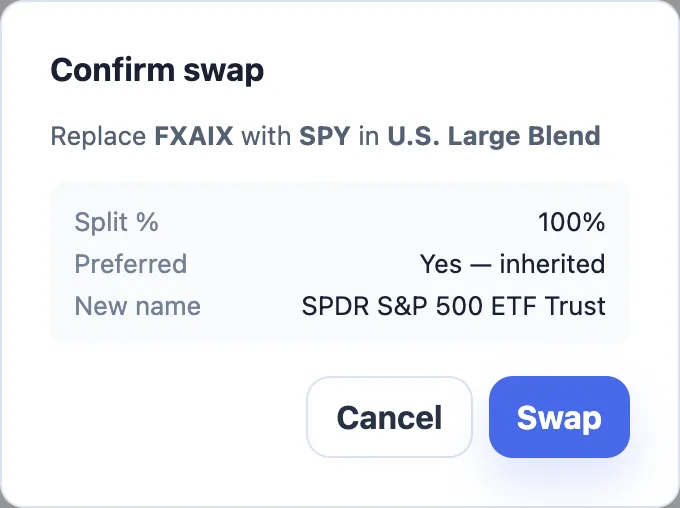
Confirm the swap and the model updates in place. Screening and editing are one motion.
- ✓An honest Score, not a star rating: blended 10Y/5Y/3Y/1Y/YTD returns over a risk-free hurdle, divided by volatility, shrunk for thin track records, and penalized for expense ratio, drawdown and inconsistency. Every weight is a visible, tunable setting.
- ✓NTF & Morningstar data alongside: bulk-import Fidelity/Schwab fund lists so candidates carry no-transaction-fee flags, expense ratios and star ratings; filter by the broker you actually use.
- ✓An Optimizer for the whole model ranks substitution candidates for every slice at once on composite return, risk and cost, with attribution that shows what each swap gains and gives up. It is deterministic, so two runs are comparable.
Backtest any allocation like a fund factsheet
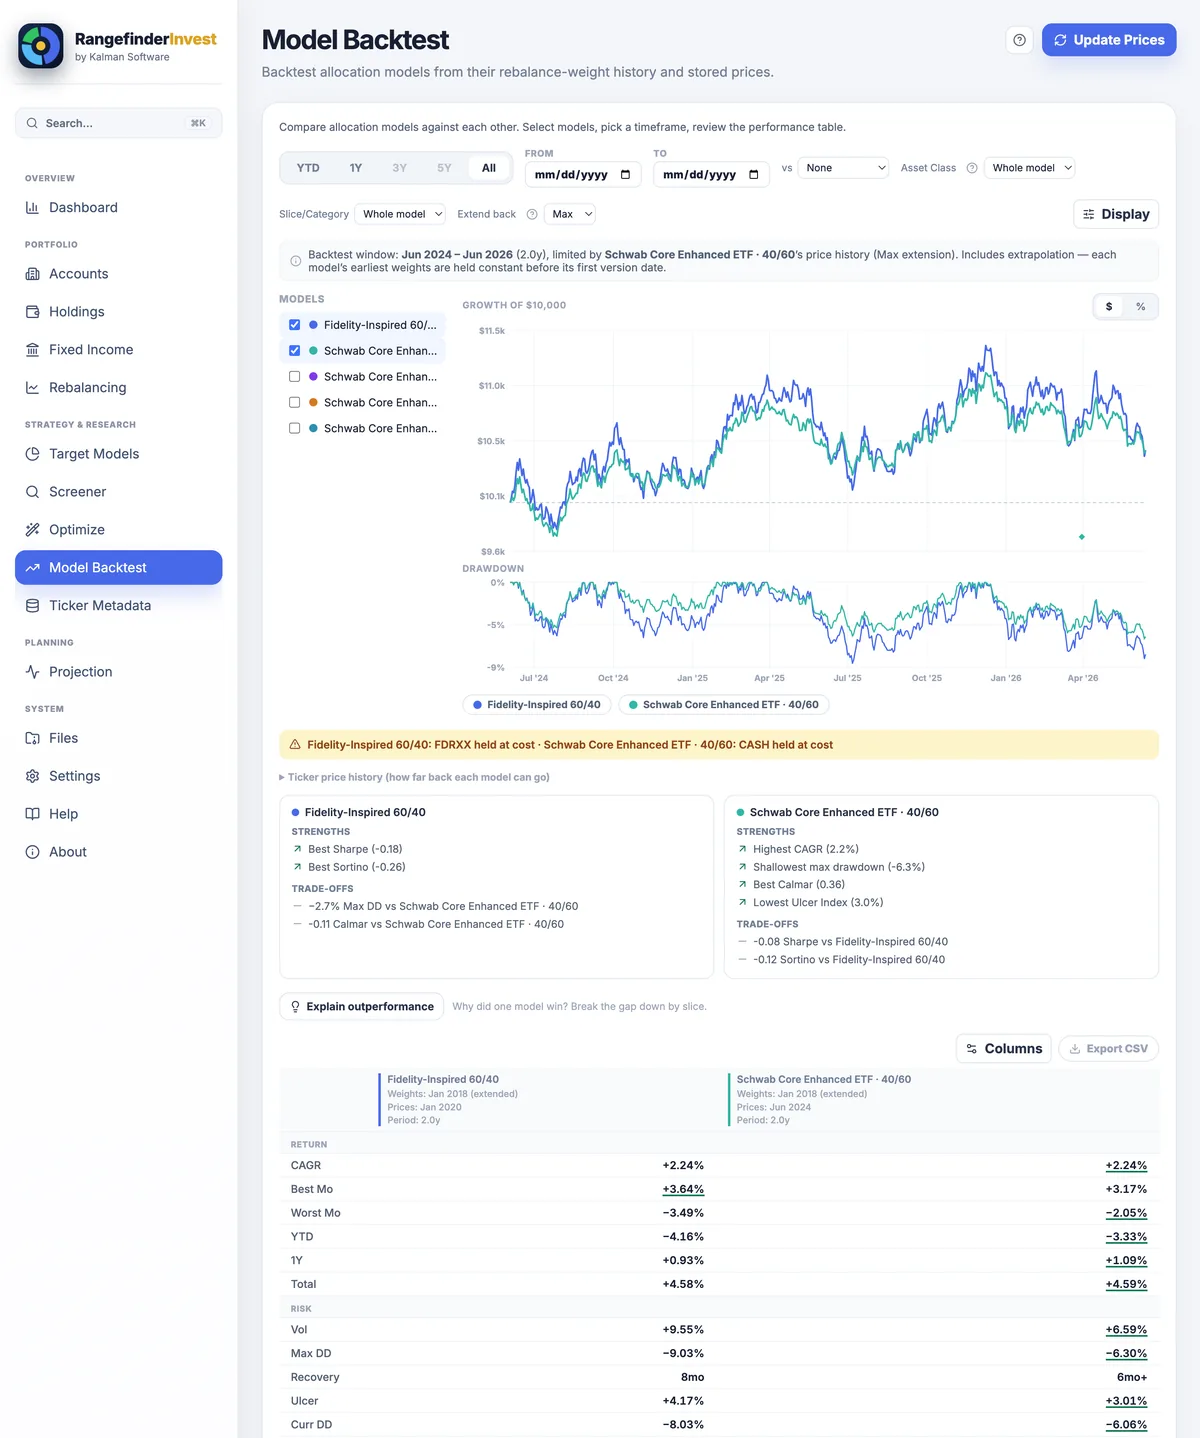
Before you commit money to a model, whether yours or the one an advisor is charging you 1% for, replay it against history and read the result like a tearsheet. Compare several models at once over the honest common window:
| Model | CAGR | Volatility | Max DD | Total |
|---|---|---|---|---|
| Fidelity-Inspired 60/40 | 5.75% | 9.18% | −14.38% | +11.97% |
| Schwab Core Enhanced ETF · 40/60 | 5.67% | 6.48% | −8.47% | +11.80% |
- ✓Growth of $10,000 with a synced drawdown subchart (peak → trough → recovered), plus CAGR, volatility, Sharpe, Sortino, Calmar, best/worst periods and monthly-return views.
- ✓Benchmark overlay: any ticker or another of your models. A target-date fund makes a natural yardstick: overlay the one you'd hold by default and see excess CAGR, beta, tracking error, information ratio and up/down capture against it.
- ✓An honest window: a banner states the true common data window; presets it can't cover are disabled, not silently truncated, and any extrapolation is disclosed on the chart.
Score your own universe
Load a sample and open the Screener. The ranking, the slice-fit grades and the backtest tearsheet are all populated before you enter anything of your own.
30 days, every feature, no card and no account. Then read-only, never locked.