
"When can I retire, and will the money last?"
The question the whole app exists for. RangefinderInvest runs a seeded Monte-Carlo projection of your entire household in today's dollars, starting from your real balances split by tax treatment. It models the things that actually decide the answer: income and contributions while you work, spending in retirement, Social Security, per-owner RMDs, and real federal taxes, year by simulated year.
From your first paycheck to your last withdrawal
Four sample households ship with the app, one per life stage, so you can explore every scenario before touching your own data. Every figure below is real output from a deterministic run on these samples.
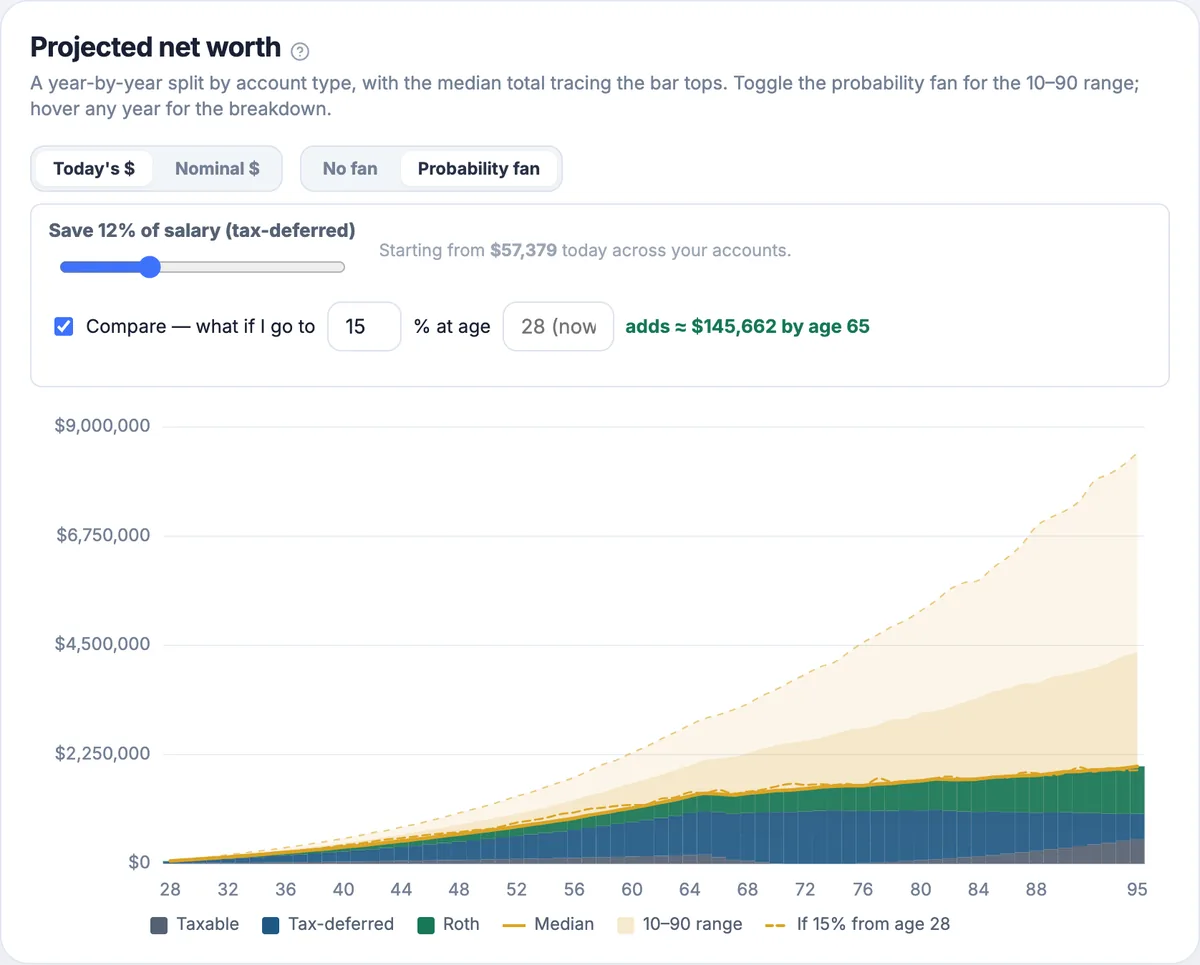
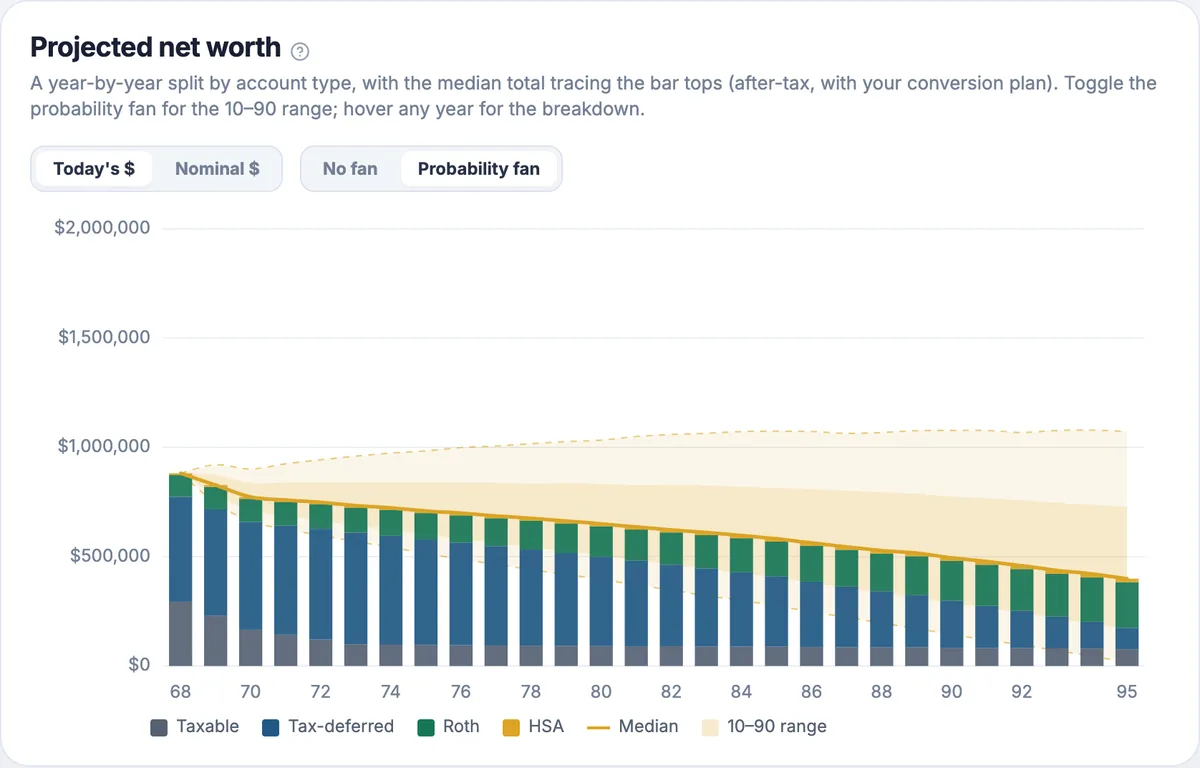
Fictional demo Four sample households (≈$57k / $352k / $882k / $1.09M) ship with the app. Every number here is read from a deterministic run on those samples, and every chart is a real capture. Reproduce any of it: Files → load a sample → open Projection.
One plan, three verdicts on purpose
A single return model can make one result look more certain than it is. RangefinderInvest scores the same plan three ways, side by side, because the spread between them tells you how much your plan leans on one reading of history.
- ✓Forward · Normal: a classic forward-looking draw from expected returns and volatility.
- ✓Forward · Student-t: the same, with fat tails, because markets crash harder than a bell curve admits.
- ✓Historical: your plan replayed against the actual 1928–2025 U.S. record, with four sampling methods; the block-bootstrap default keeps the sequence-of-returns risk that sinks real retirees while breaking the one-time 1980–2020 bond tailwind.
- ✓Every knob visible: returns, inflation, spending, ages, brackets. Each assumption is a setting you can see and turn. Save any set as a named scenario and switch instantly. No black box.

Real output from a sample run: 86.6% under Forward · Normal, 85.9% under fat-tailed Student-t, 99.7% replaying 1928–2025. The 13-point spread is the finding. That plan was leaning on history's bond bull.
A real tax engine, not a flat haircut
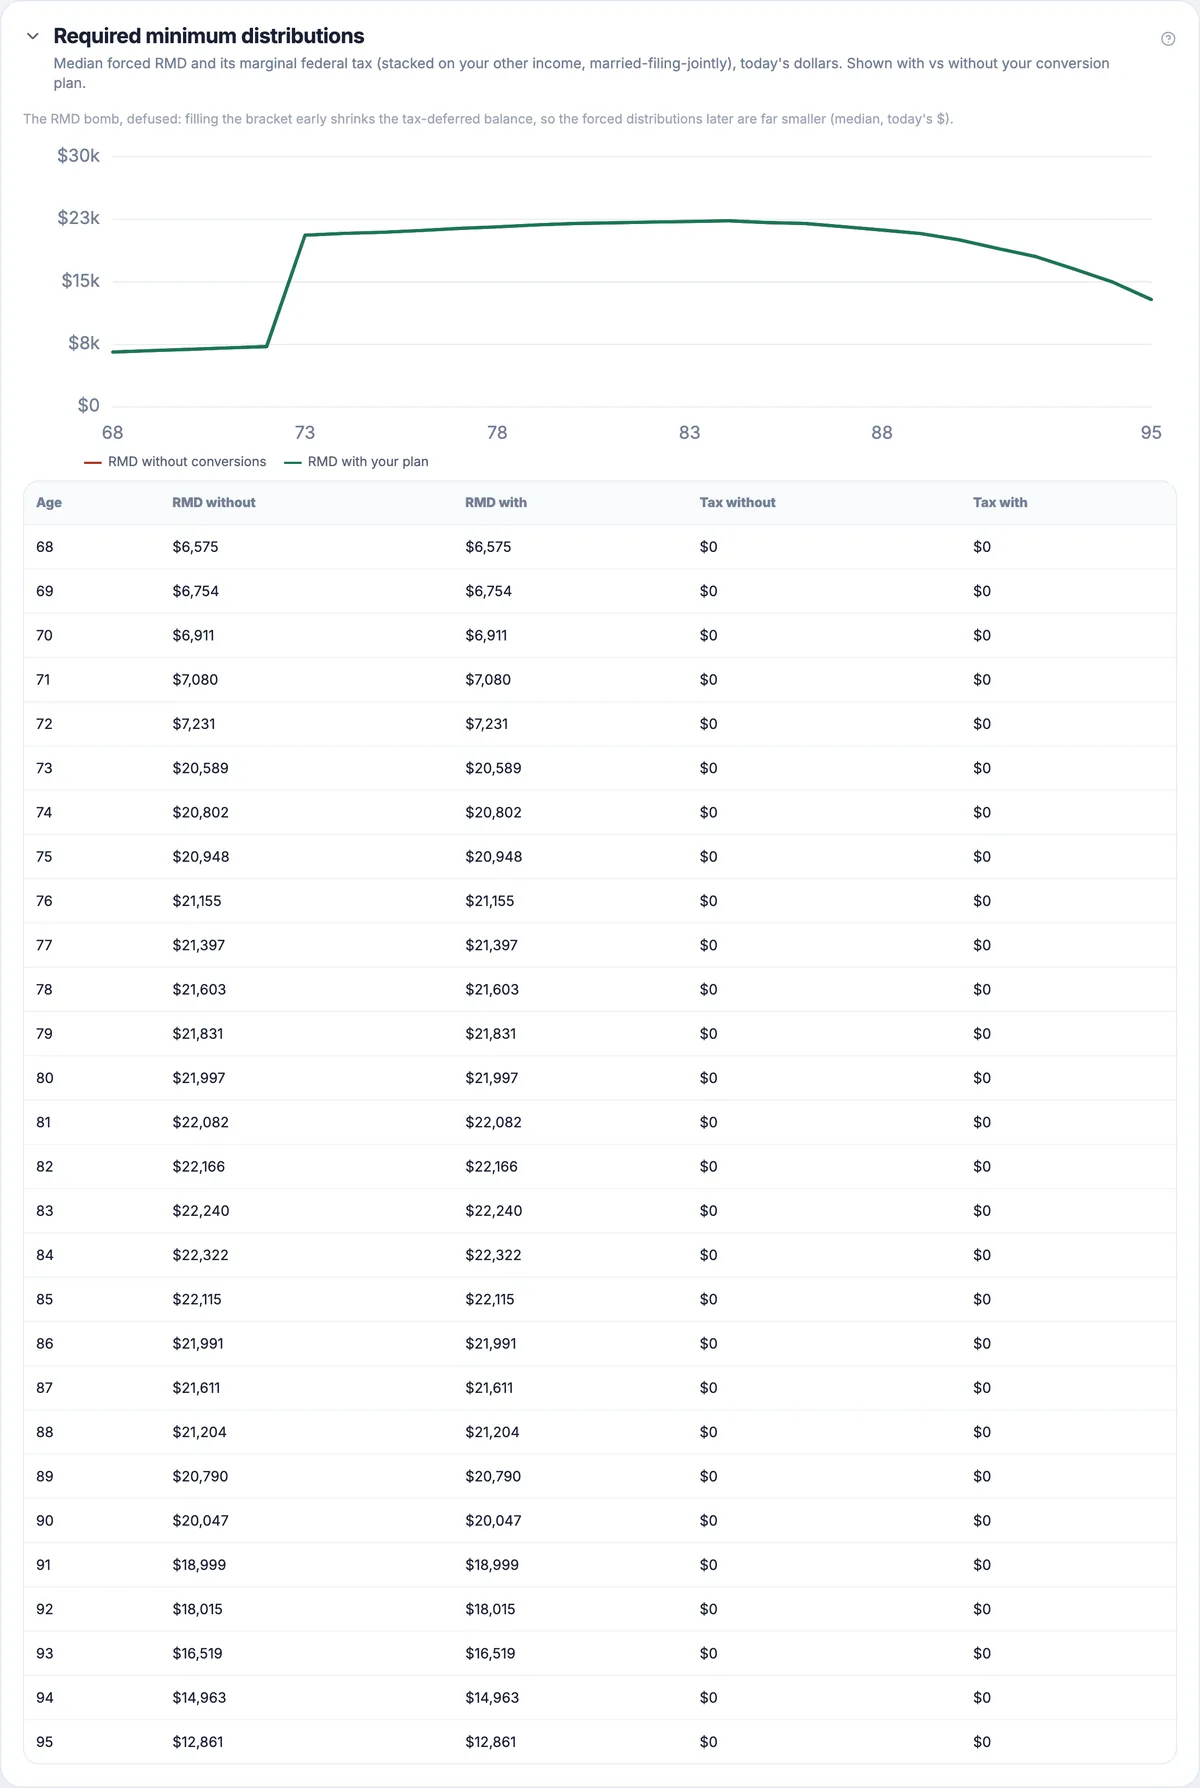
Every simulated year is taxed properly, in today's dollars. The projection knows a dollar in your IRA is not a dollar in your Roth. On top of that sits the optimizer retirees actually need: fill-to-bracket Roth conversions in the lean years between retiring and RMDs.
- ✓Federal brackets + standard deduction, a flat state rate, the Social-Security provisional-income worksheet (0 / 50 / 85% taxable), and ACA / IRMAA income ceilings.
- ✓Per-owner RMDs on each spouse's own SECURE-2.0 start age and the IRS Uniform Lifetime Table, charted with and without your conversion plan so you see the balloon deflate.
- ✓Fill-to-bracket conversions: top off the 12%, 22% or 24% bracket every year it's cheap, automatically zero once Social Security and RMDs fill it themselves.
- ✓Documented simplifications: ordinary-income only, no LTCG/NIIT stack, stated right on the reference panel. Honest about what it doesn't model.
Built for the years the money goes out
Retirement isn't one decision. It's a decade of them. The projection models the levers that decide whether the plan holds, including the one nobody likes to look at:
- ✓Survivorship: the widow's penalty, faced squarely. At the first death the plan files MFJ → Single: brackets and standard deduction roughly halve, Social Security drops to the larger benefit, spending steps down. You see the survivor's income and tax, not just a success rate.
- ✓A spending guardrail you could actually follow. Guyton-Klinger-style triggers are applied honestly. Instead of a blanket cut to all spending, it flexes only the share you've marked flexible or discretionary, a trim you could really make, and reports the cost in cut years so a higher success rate never hides its price.
- ✓"When can I retire?" An optimizer sweeps your retirement age and reports the earliest year your plan clears the success bar you set.
- ✓Home affordability: the priciest home your plan still supports at your chosen success target, the smartest way to pay for it, and what that answer becomes if you wait a year or two (just below).
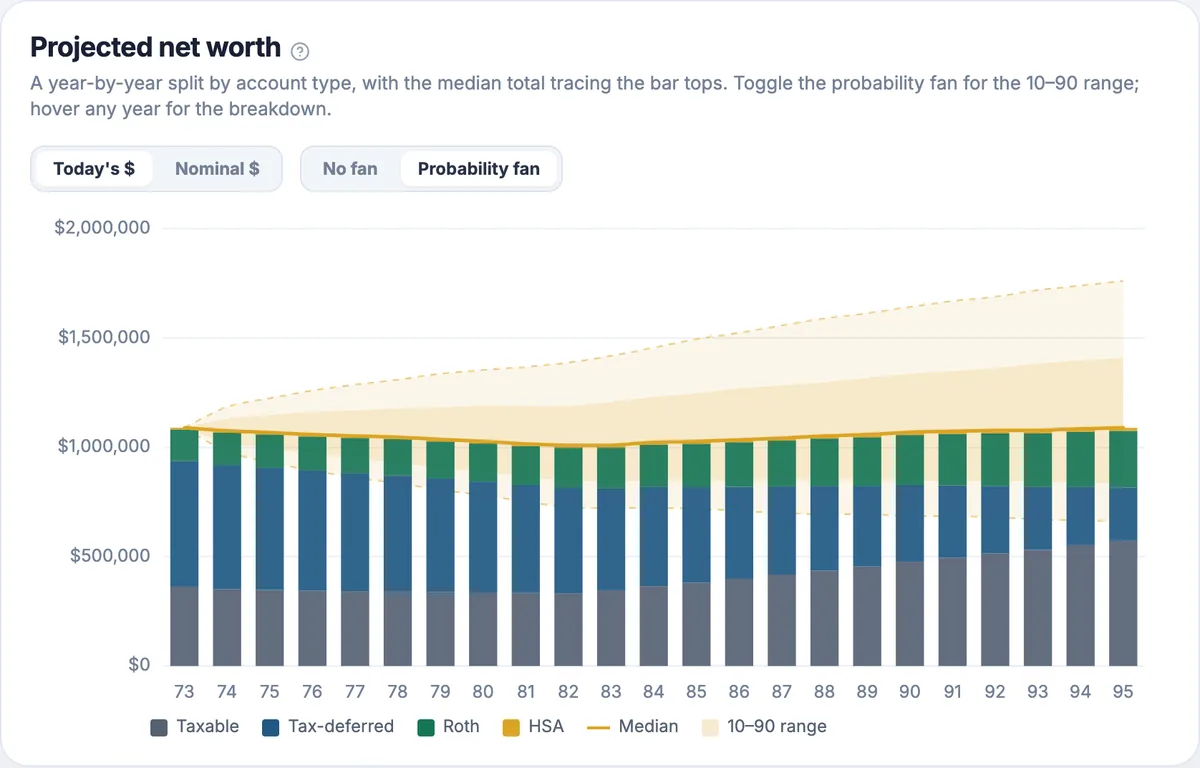
Every chart in this section is a real capture from a bundled sample. Load it and you'll see the same thing.
"How much house, and what if I wait?"
A single affordability number hides the path that produced it. This view shows what the number leans on, then re-solves it against the market you'd have lived through if you waited.
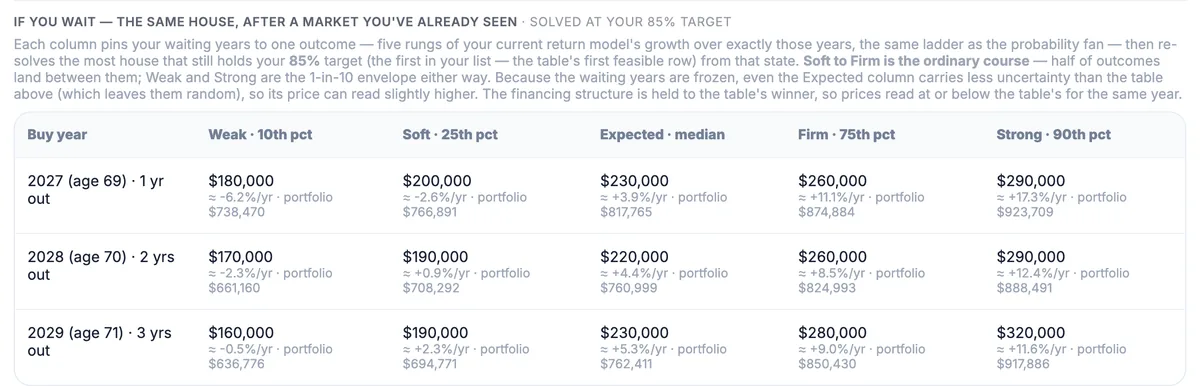
Real capture, near-retirement sample. Wait one year and the answer spans $180k–$290k; wait three and it spans $160k–$320k. The downside falls, the upside rises, and the widening is the answer to "should I wait?"
- ✓The columns are your own return model, not a mood. Weak · 10th, Soft · 25th, Expected · median, Firm · 75th, Strong · 90th are that model's growth over exactly the waiting years, the same five-band ladder the probability fan draws. Soft to Firm is the ordinary course: half of all outcomes land between them, while Weak and Strong mark the 1-in-10 envelope either way.
- ✓Every cell re-solves the house, financing held fixed to the one the main table picked, and prints the portfolio you'd be sitting on at that buy year. When the wait is actually over, you read your real balance against the column you turned out to be living in.
- ✓One success target, named on the grid. Every cell is solved at the first target in your list, and the heading says which, with no quiet mixing of standards between rows.
- ✓It says where it's more confident than the table above. Pinning the waiting years to one outcome removes uncertainty the main table keeps, so those prices can read slightly high. The panel tells you that rather than letting you find out. Under Historical replay the grid switches itself off because pinning the first years would erase the realized-sequence signal that lens exists to show.
- ✓And the recommendation is scored three ways. Each home the finder lands on is run under Forward · Normal, Student-t and Historical side by side, the same trio as the rest of the projection, with a footnote stating exactly what each model ran with.
Run your own numbers
Load a sample household and open Projection, or start from your own balances. Every figure on this page is reproducible in the app in about a minute.
30 days, every feature, no card and no account. Then read-only, never locked.